Tutorial: Loading historical weather data in MATLAB
Simple tutorial to load, and display historical weather data MATLAB
In this article, we'll walk through a simple integration using the Weatherbit API in MATLAB to display historical weather data for a specific location.
Step 1: Register for an API Key Before we can use the Weatherbit API, we'll need to register for an API key. This key will authenticate our requests to the API and allow us to access weather data. To register for an API key, go to the Weatherbit website and follow the registration process. Once you've registered, you'll receive an API key that you can use to access weather data.
Step 2: Install the MATLAB JSON Toolbox To parse the JSON response from the Weatherbit API, we'll need to install the MATLAB JSON Toolbox. This toolbox provides functions for reading and writing JSON data in MATLAB. To install the MATLAB JSON Toolbox, follow these steps:
- Download the latest version of the MATLAB JSON Toolbox from the MathWorks File Exchange website.
- Extract the downloaded files to a folder on your computer.
- Add the folder containing the extracted files to your MATLAB path.
Step 3: Make a Request to the API Now that we have an API key and the MATLAB JSON Toolbox installed, we can make a request to the Weatherbit API to get weather data for a specific location. We'll use the API's historical weather data endpoint to get historical weather data.
To make a request to the API, we'll need to construct a URL that includes our API key and the location and date range we want to get weather data for. For example, to get weather data for New York City from March 1, 2022 to March 15, 2022, we could construct the following URL:
https://api.weatherbit.io/v2.0/history/hourly?city=New%20York,NY&start_date=2022-03-01&end_date=2022-03-15&key=your_api_keyNote that we need to URL encode the city name and state code (in this case, "New York" and "NY") to replace spaces with %20, and that the dates are formatted as yyyy-mm-dd.
We can make this request using MATLAB's built-in functions for web requests. Here's an example:
url = 'https://api.weatherbit.io/v2.0/history/hourly?city=New%20York,NY&start_date=2022-03-01&end_date=2022-03-15&key=your_api_key';
response = webread(url);
This code constructs the API request URL and uses the webread function to make a GET request to that URL. The response variable will contain the API's response in JSON format.
Step 4: Parse the Response The API response will be in JSON format, so we'll need to parse it to extract the weather data we're interested in. Here's an example of how we might parse the response in MATLAB:
json = response;
data = jsondecode(json);
dates = datetime({data.data.datetime},'InputFormat','yyyy-MM-dd HH:mm:ss');
temperatures = [data.data.temp];
This code uses the jsondecode function from the MATLAB JSON Toolbox to parse the JSON response into a MATLAB struct. We can then access the temperature and date data using dot notation.
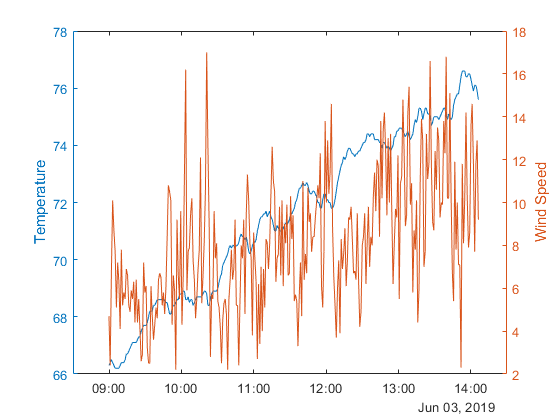
Step 5: Display the Results Now that we have the temperature and date data, we can display it to the user. One way to do this is to create a chart that shows the temperature data over time. Here's an example of how we might create such a chart in MATLAB:
plot(dates, temperatures);
title('Temperature in New York City, March 2022');